Competing Public Transport Lines: A Drain on Efficiency or an Untapped Opportunity?
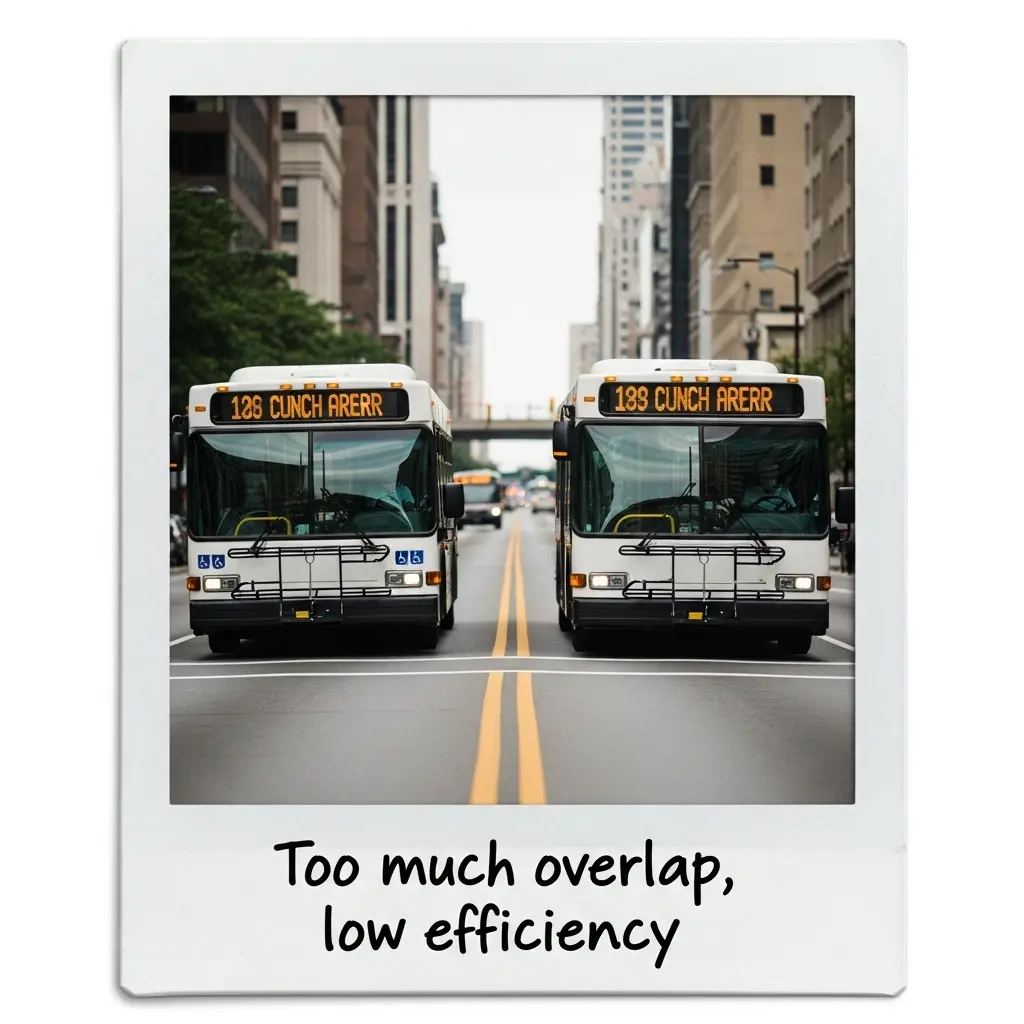
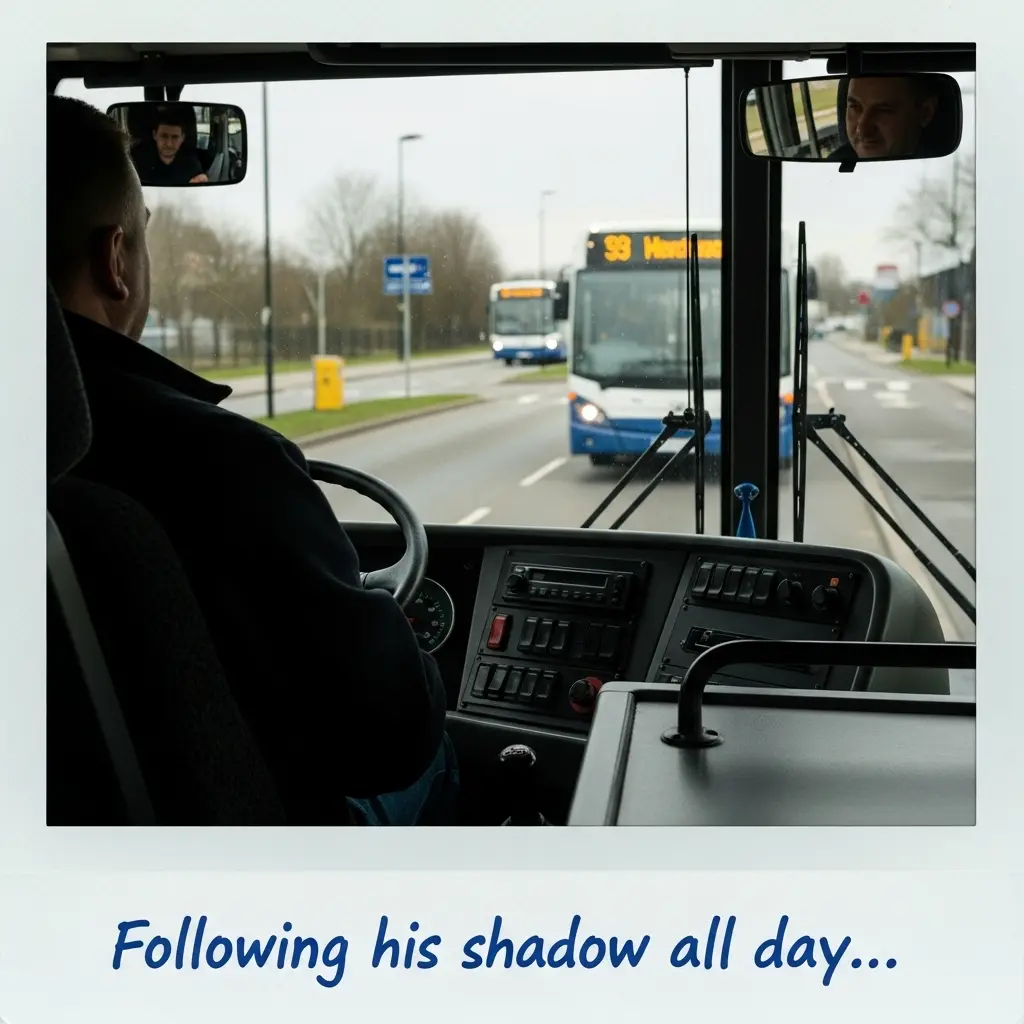
A common scene plays out daily on many city arteries: two or more buses with different line numbers travel the same corridor mere minutes apart, seemingly chasing the same passengers. This is not strategic service design; it's often the result of unplanned growth and historical legacy: competing public transport lines.
This phenomenon represents more than just visible resource waste. It is a structural flaw that weakens the city's mobility potential, confuses passengers, and inflates operational costs. But why does this competition emerge, and how can it be transformed into cooperation?
The Hidden Costs of Visible Competition
Competing lines often originate with good intentions: a new neighborhood develops, and extra trips are added to an existing line. Over time, these extra trips gain a separate line identity. Another operator begins service on the same corridor. The result is a "service proliferation" between the same key points, lacking coordination and efficiency.
The hidden toll of this setup is heavy:
High Operational Cost: You deploy twice the vehicles and personnel for the same pool of passengers.
Low Line Efficiency: Both lines run half-full, missing the opportunity for consolidated, frequent, and well-utilized services.
Passenger Confusion: Questions like "Which one is faster?" or "Which one comes more often?" create friction and deter ridership.
Added Burden on City Traffic: Unnecessary numbers of transit vehicles contribute to general traffic congestion.
Analysis: Understanding the Problem at Its Root

Detecting this competition requires not simple observation, but data-driven system analysis. The goal is to quantitatively answer: "Which lines overlap, where, how much, and why?"
Tools like OW CompAnalytics™ provide graph-theoretic analysis that quantifies duplication, feeder relationships, and network redundancy—transforming subjective observations into measurable decision variables.
Critical steps in the analysis process include:
Overlap Mapping: Using GTFS data, OW CompAnalytics™ calculates the degree of overlap between lines based on route alignment, stops, and schedules. An overlap of 70% or more indicates strong competition and consolidation potential.
Passenger Load Analysis: Compare passenger occupancy rates for each line on the overlapping segments. If one is full and the other is empty, it signals a severe resource allocation imbalance.
Service Frequency Examination: Is the total combined frequency on the overlapping corridor greater than the optimal frequency needed to meet demand?
Institutional/Operator Boundaries: Is the competition occurring between different operators (municipal, private) or different planning units?
This analysis reframes the issue from one of personal or institutional preference to a scientific optimization problem. By applying OW CompAnalytics™, transit authorities gain objective metrics—overlap indices, redundancy scores, and network hierarchy classifications—that support rational network design decisions.
Re-planning: The Shift from Competition to Cooperation
The analysis findings pave the way for a "what-if" scenario phase. The goal of re-planning is to eliminate competition by creating a complementary and synergistic network structure.
Core strategies include:
Line Consolidation/Merging: Highly overlapping lines are merged into a single, higher-frequency line. Freed resources are redirected to cover service gaps in other corridors.
Creating a Service Hierarchy: A high-capacity, frequent "trunk line" is defined for the main corridor. Competing lines are transformed into "feeder lines" that distribute passengers from neighborhoods to this main trunk.
Coordinated Scheduling and Transfer Hubs: Physical and schedule integration is ensured between lines. Passengers experience faster, seamless journeys through coordinated transfers instead of waiting between competing services.
Institutional Cooperation Models: Competition between different operators is transformed into efficient partnership through models like revenue sharing or corridor responsibility agreements.
The Benefits: Gains from a Smarter Network
Proper analysis and bold re-planning transform an operational burden into a strategic opportunity.
Average 15-25% Operational Savings: Redundant trips and vehicle usage are eliminated. OW CostLogic™ separates structural costs from decision-driven costs, revealing where network reconfiguration truly influences financial outcomes and enabling budget discussions to move from totals to measurable decision impact.
Enhanced Service Quality: Consolidated lines offer more frequent and reliable service, with reduced travel times.
Broader Network Coverage: Freed resources can be allocated to underserved areas.
A Clearer, More Understandable System: Passengers face a clear service hierarchy instead of a confusing array of similar options.
Improved Sustainability: Carrying more passengers with fewer vehicles reduces the system's carbon footprint.
Conclusion: Competition Should Be with the Car, Not Within the Network

The true competition in public transport should be with private vehicle use, not within our own systems. By ending the inefficient rivalry between duplicate lines, we can focus our resources on the city's real mobility challenges.
This transformation requires not only bold decisions but also advanced analytics tools capable of modeling complex network interactions and objectively presenting the optimal scenario for all stakeholders. OW CompAnalytics™ identifies route overlap and competition patterns through graph-theoretic analysis, while OW CostLogic™ quantifies the financial impact of consolidation decisions—together providing the analytical foundation for strategic network re-planning that delivers measurable societal benefit.
Discover if hidden inefficiencies exist in your city's public transport network and learn how to turn them into powerful cooperation.
Discover how OW CompAnalytics™ and OW CostLogic™ help identify and eliminate inefficient competition in transit networks | Contact us to transform your network
Related Posts
Continue with adjacent topics—from mixed-integer programming (MIP) and combinatorial optimization to multi-objective scenario modeling in public transit.
Beyond Routing: Why Static Scheduling is Killing Your Fleet Efficiency
Every morning, public transport planners look at maps that seem perfectly organized. But there is a silent observer that static plans fail to account for: the inherent volatility of urban life.
GTFS Data vs. Service Quality
Every public transport system runs on two essential fuels: the diesel or electricity that powers its vehicles, and the data that powers its decisions. While the first is meticulously measured and managed, the second—specifically your GTFS data—often operates in the shadows.